# This is an R code chunk

summary(mtcars$mpg)
Min. 1st Qu. Median Mean 3rd Qu. Max.
10.40 15.43 19.20 20.09 22.80 33.90 R Markdown is a file format that combines R code with Markdown, a simple formatting syntax for authoring HTML, PDF, and MS Word documents.
This means you can embed R code into a report, run it, and then display the results. It’s a really useful way to present both the process of analysis, and its results.
You need to have:
R installed
RStudio installed
The rmarkdown package installed. If not, install it with:
install.packages("rmarkdown")Open RStudio.
Go to File > New File > R Markdown...
A dialogue box will pop up. For now, keep the default options (HTML output) and click OK.
You’ll see a template document.
R Markdown uses Markdown syntax. Here are some basics:
Headers are created using hash symbols: # Header 1, ## Header 2, ### Header 3
Lists are created with dashes: - item 1, - item 2, * item 3
Bold is created with two asterixes: **bold**
Italics are created with a single asterix: *italic*
Links can be embedded: [Google](https://www.google.com)
Activity 1: In a new section, create a header called “Introduction”, write a brief intro about your favourite sport, and include a link to its official website.
This is the key strength of R Markdown for our purposes. You can embed chunks of R code. You begin by typing {r}, then your code, then to close the chunk.
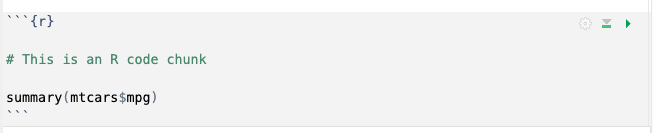
Including the text above will produce the following output:
# This is an R code chunk
summary(mtcars$mpg) Min. 1st Qu. Median Mean 3rd Qu. Max.
10.40 15.43 19.20 20.09 22.80 33.90 When the report is rendered, it will show both the code and its output.
Activity 2: Create a new code chunk and calculate the mean and median of the mpg column in the mtcars dataset.
You can also include visualisation data within your report:
library(ggplot2)
data(mtcars)

ggplot(mtcars, aes(x=mpg, y=wt)) + geom_point() + ggtitle("Scatterplot of MPG vs Weight")
Activity 3: Use the mtcars dataset to create a histogram of the mpg column.
Once your R Markdown document is ready, it’s time to “knit” it, turning it into a report.
Click the “Knit” button in the script editor panel’s toolbar. Choose the desired output format, and RStudio will render your document.
Activity 4: Knit your document.