4 Data Transformation
4.1 Introduction
Data transformation is a basic process in data analysis and machine learning. It involves converting raw data into a more suitable format for analysis.
We started learning about this in B1700.
By implementing these transformations, we can ensure data quality, improve our models’ performance, and enable meaningful comparisons between different features (or variables) in our data.
In machine learning, it’s common to refer to what we might consider variables as features. The two terms are used interchangeably in this module.
Transformation techniques like scaling, standardisation, and normalisation help address common data challenges such as:
Inconsistent scales between different features;
Non-normal distributions that may affect statistical analyses;
Outliers that could skew results; and
Missing or incomplete data that needs pre-processing.
4.1.1 Scaling, standardisation, and normalisation
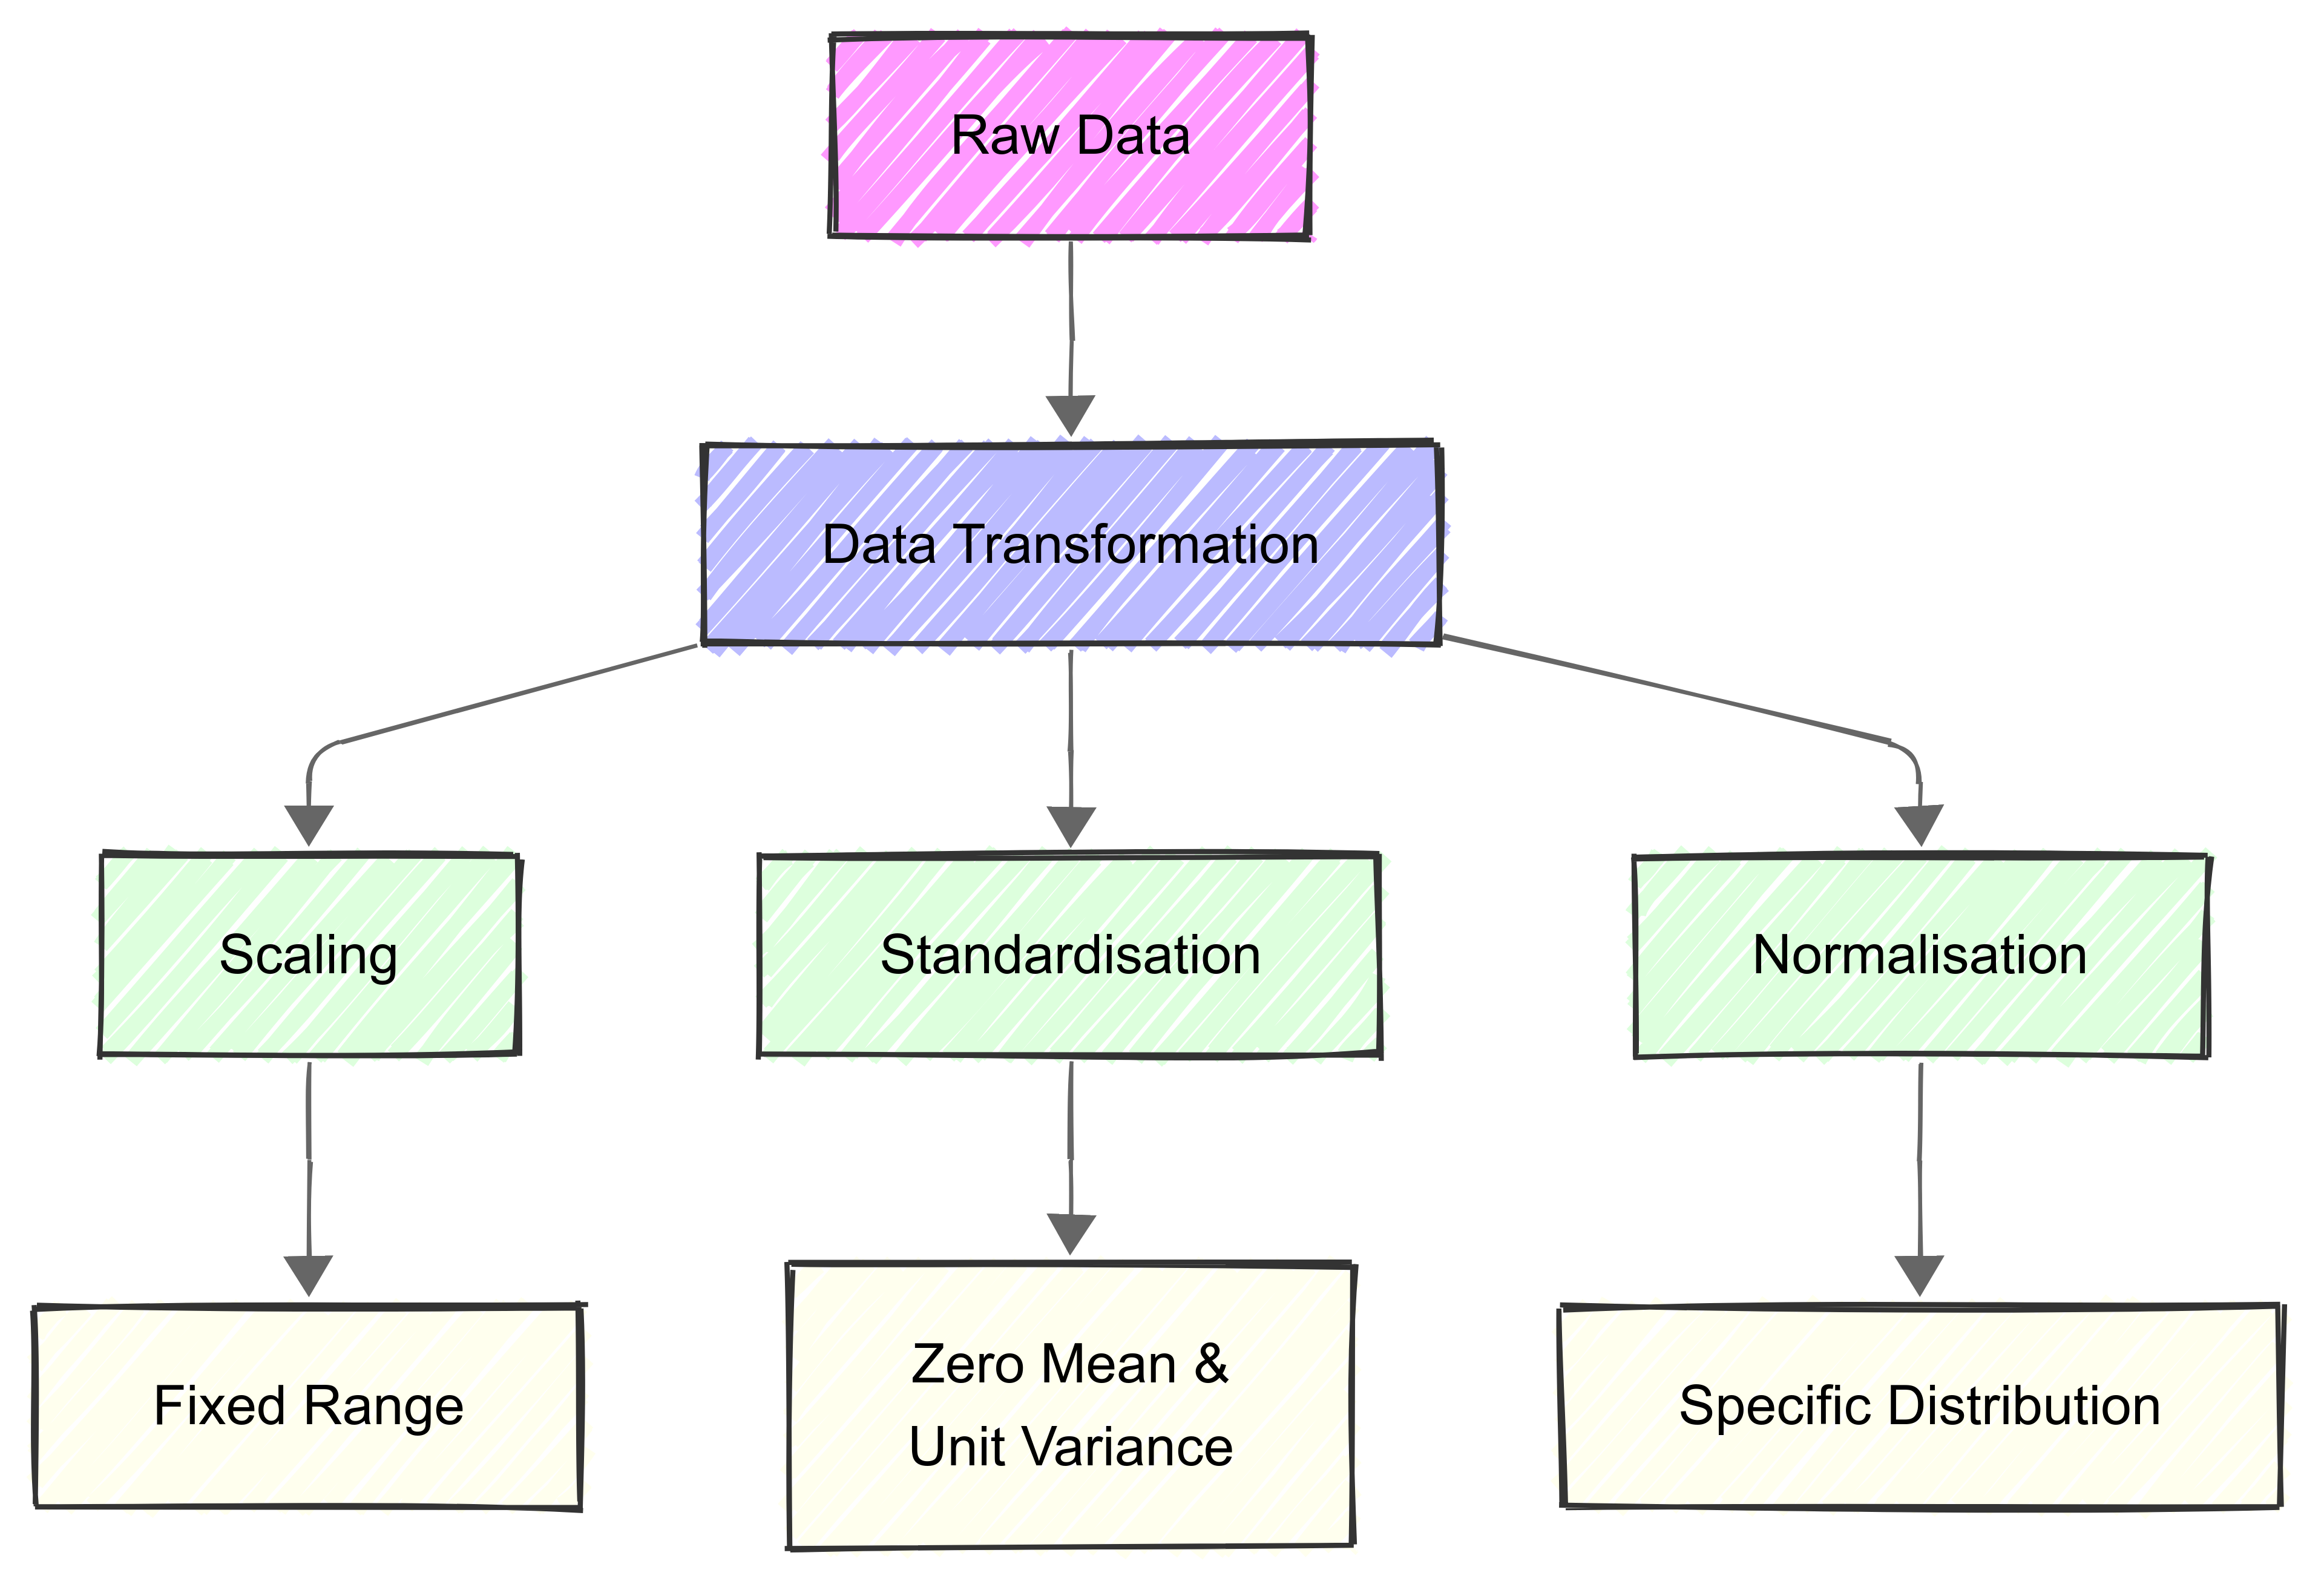
Scaling, standardisation, and normalisation are data pre-processing techniques we can use to adjust feature values for consistency and comparability.
Scaling ensures features fit within a specified range.
Standardisation transforms the data to have a mean of 0 and a standard deviation of 1.
Normalisation also transforms data to fit a specific range or magnitude.
4.2 Scaling
4.2.1 Introduction
Scaling our data is essential when features have different units or scales, because many machine learning algorithms perform better or converge faster when features are on a relatively similar scale.
Scaling adjusts the range of data to ensure all features fit within a specific interval.
This is useful for maintaining relative differences between values while ensuring data fits within a defined range.
For example, if one feature ranges from 0-1 while another ranges from 0-1000, the second feature will have a disproportionate impact on the model’s decisions unless proper scaling is applied.
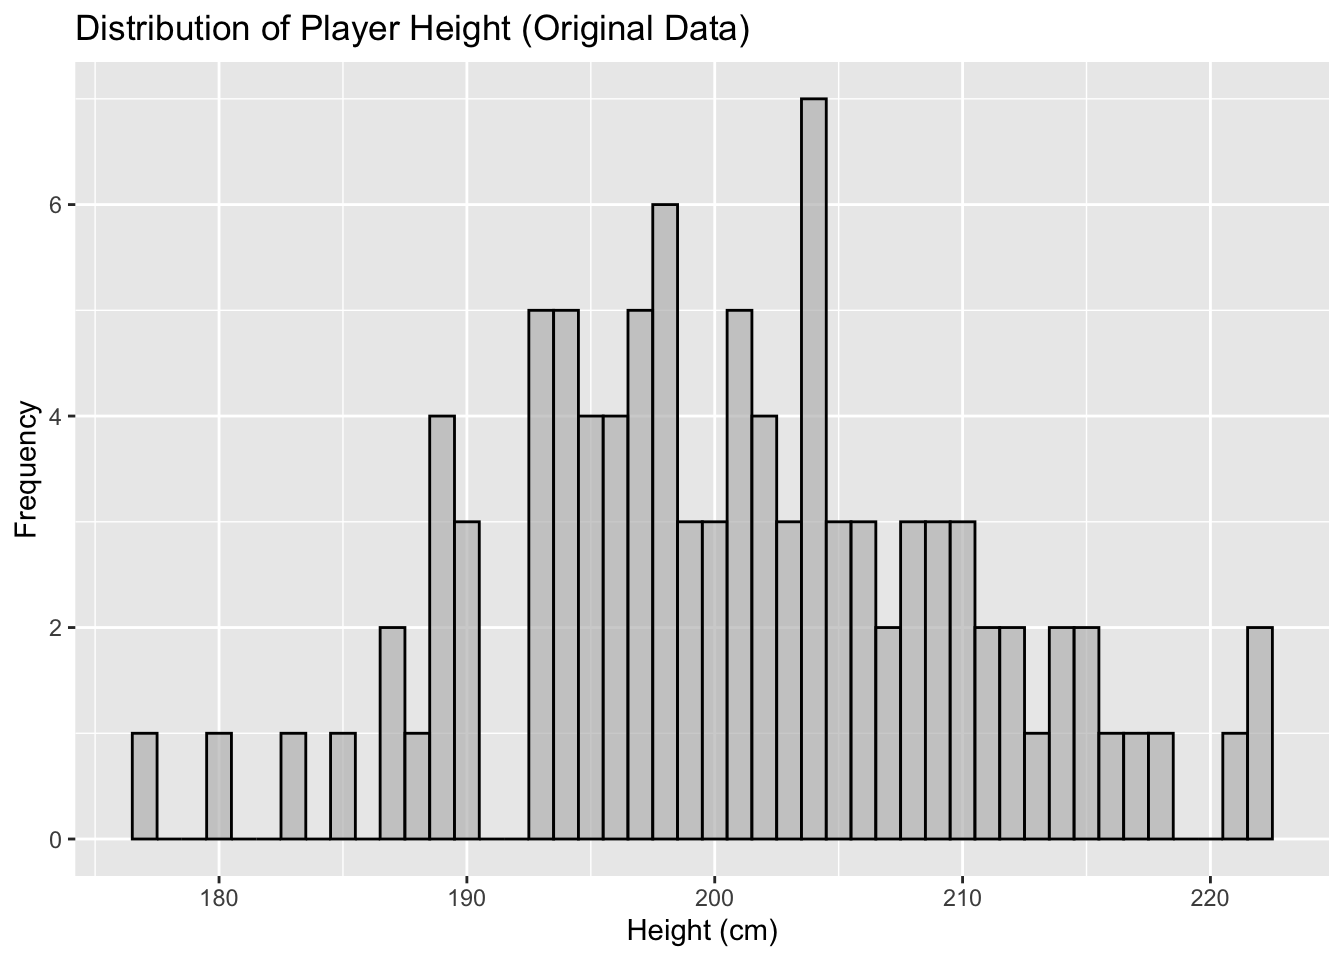
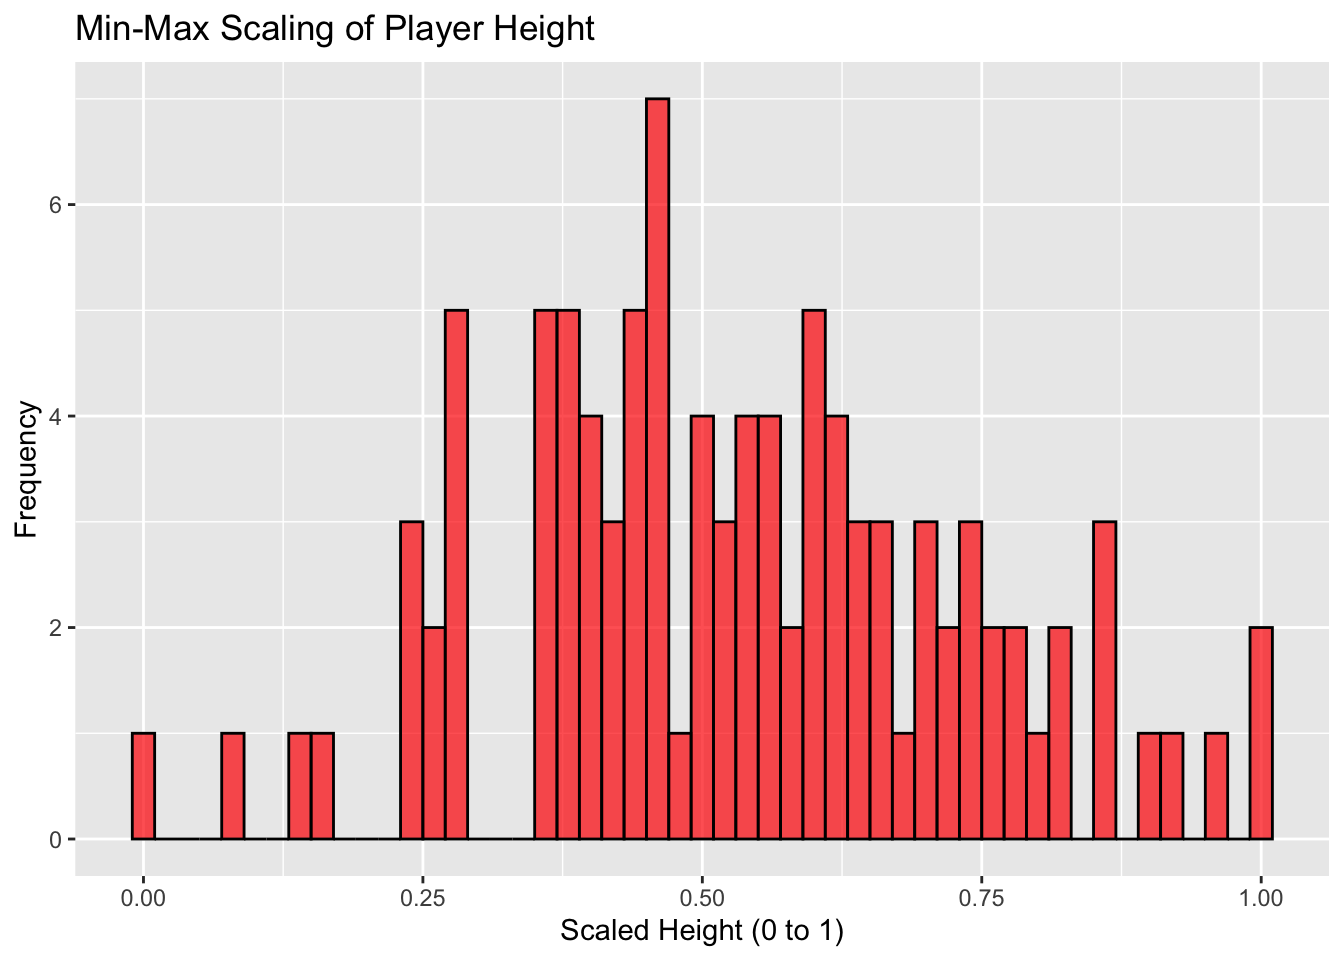
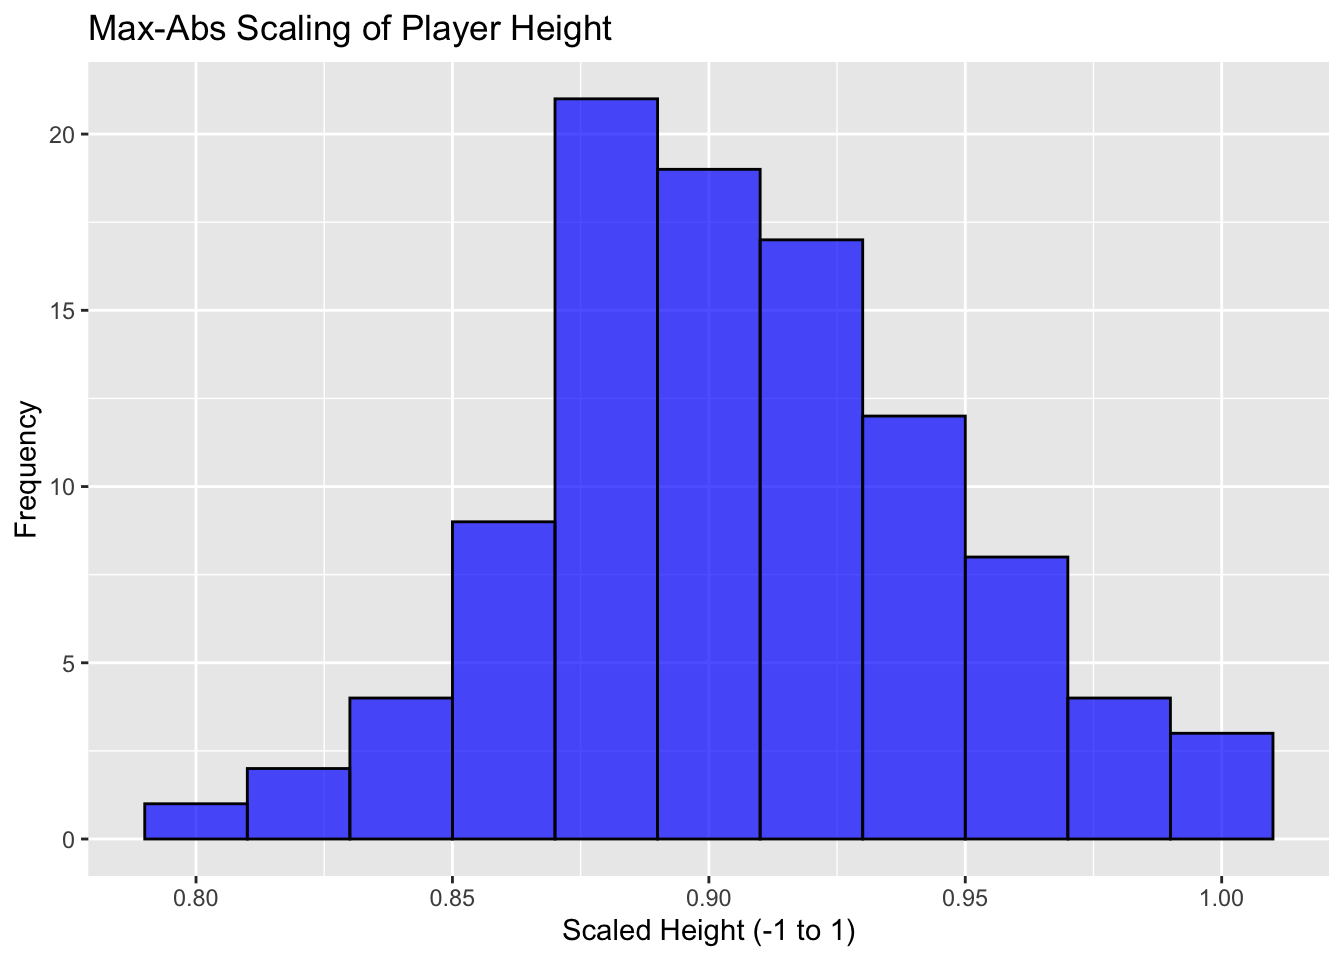
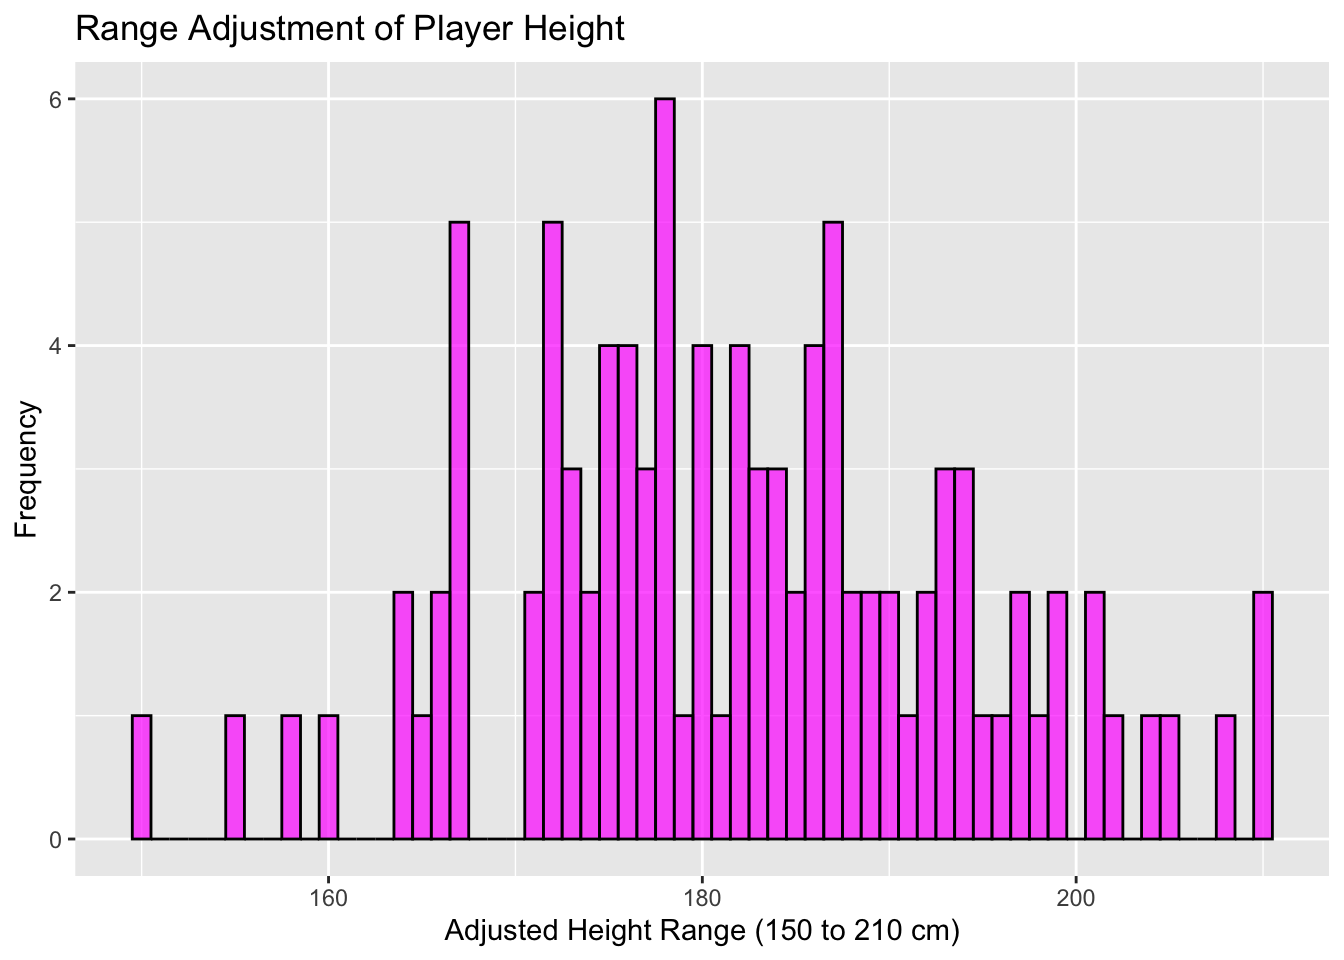
There are a few common approaches to scaling that we’ll cover in the following section. We’ll start with the following data, which is a frequency plot of player height (cm).
4.2.2 Min-Max Scaling
Min-max scaling transforms data to a specified range, typically 0 to 1.
4.2.3 Max-Abs Scaling
Max-abs scaling scales the data to the range [-1, 1] by dividing by the maximum absolute value.
It’s most useful for data that is already centered at zero without outliers.
4.2.4 Range Adjustment
Range adjustment adjusts the range of data to \([a, b]\), maintaining relative distances between values.
4.3 Standardisation
Standardisation is another scaling technique that transforms the features to have zero mean and a variance of one, making them follow a standard normal distribution.
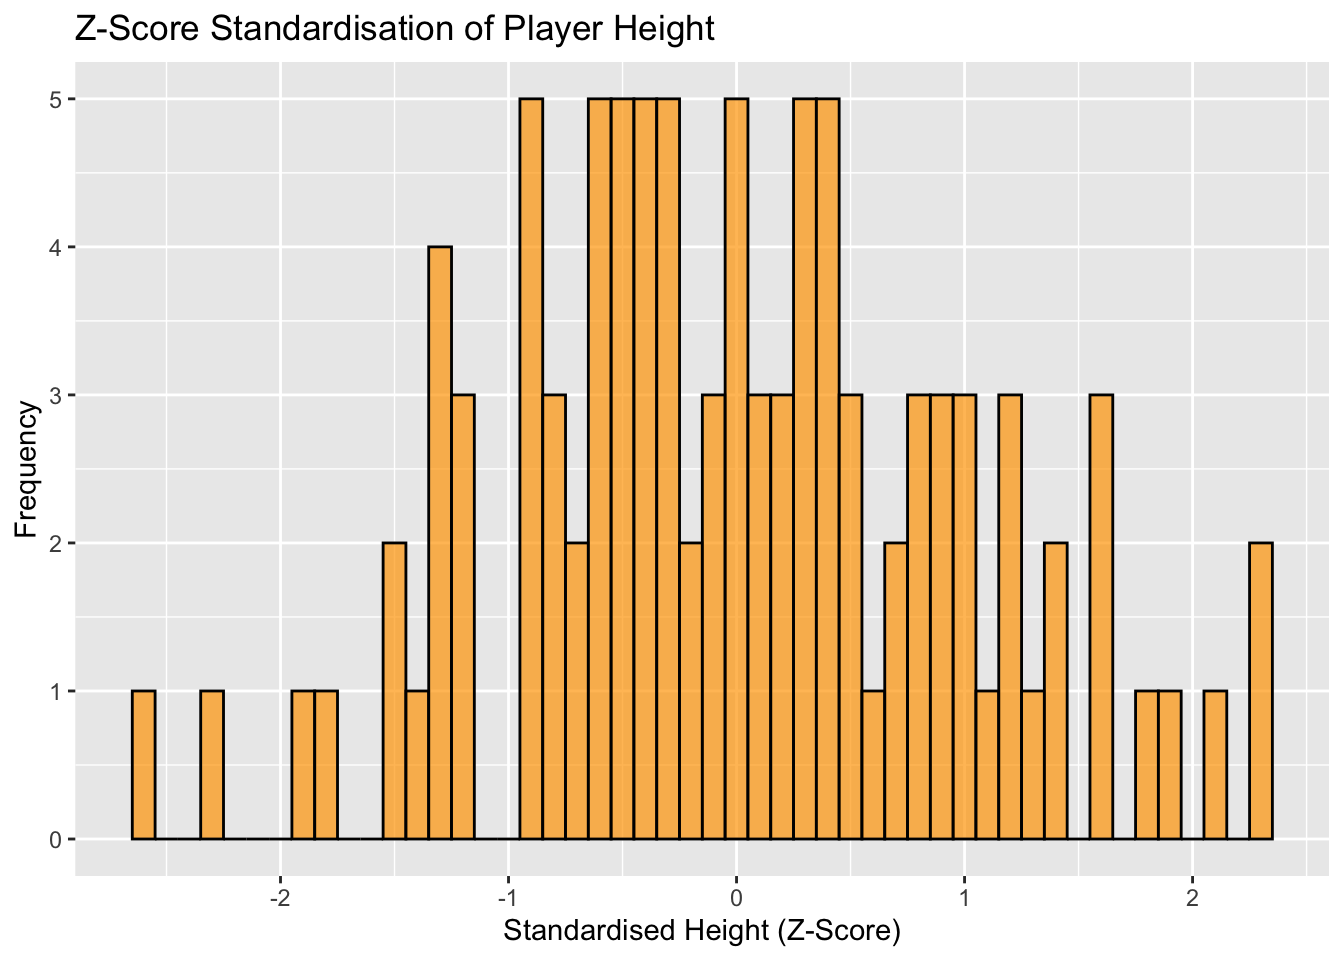
4.3.1 Z-score Standardisation
Z-score standardisation, also known as standard score, involves subtracting the mean and dividing by the standard deviation.
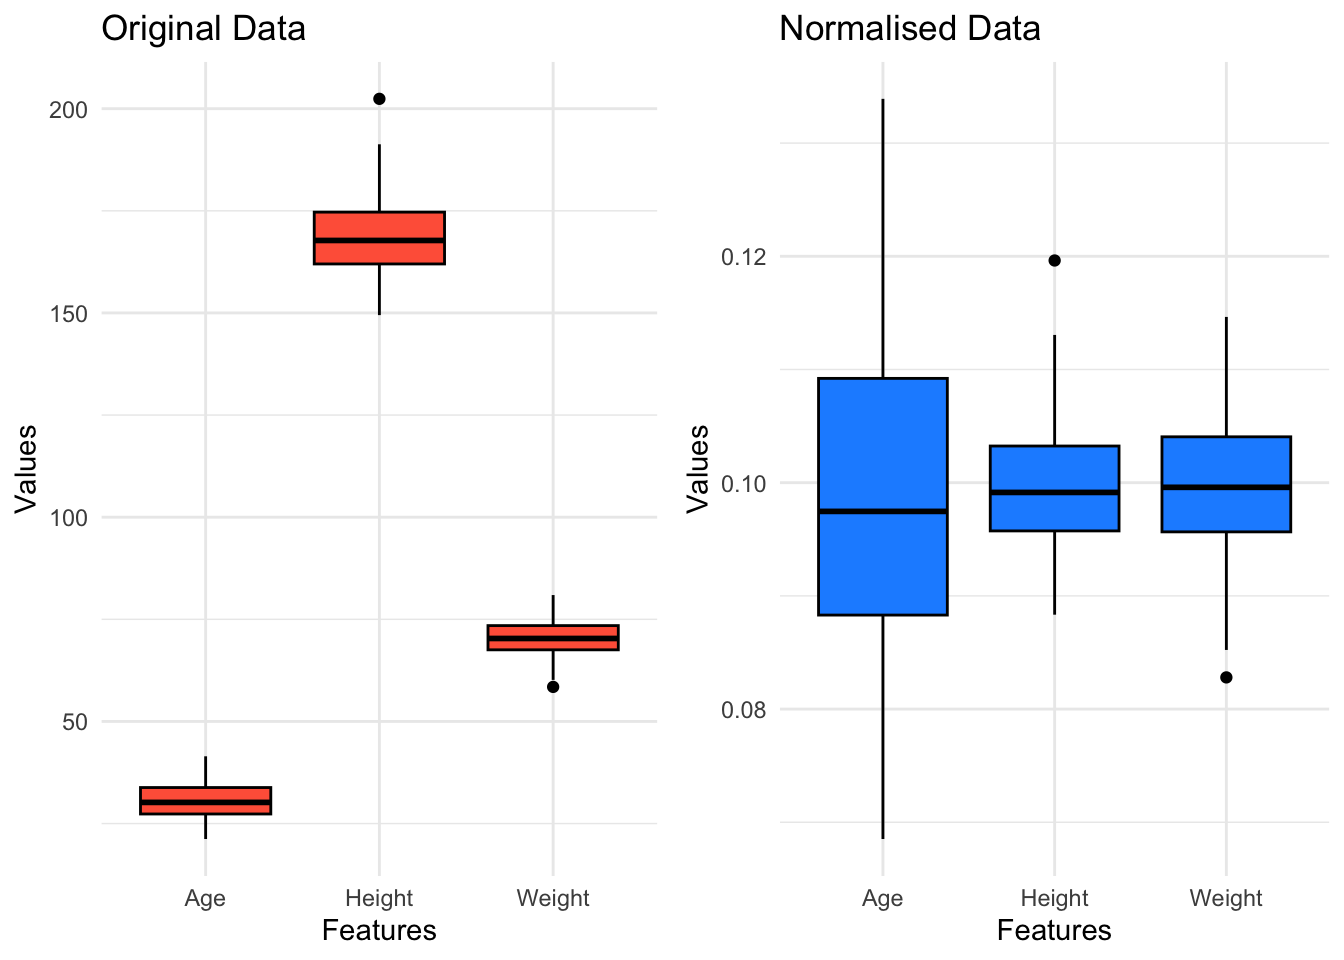
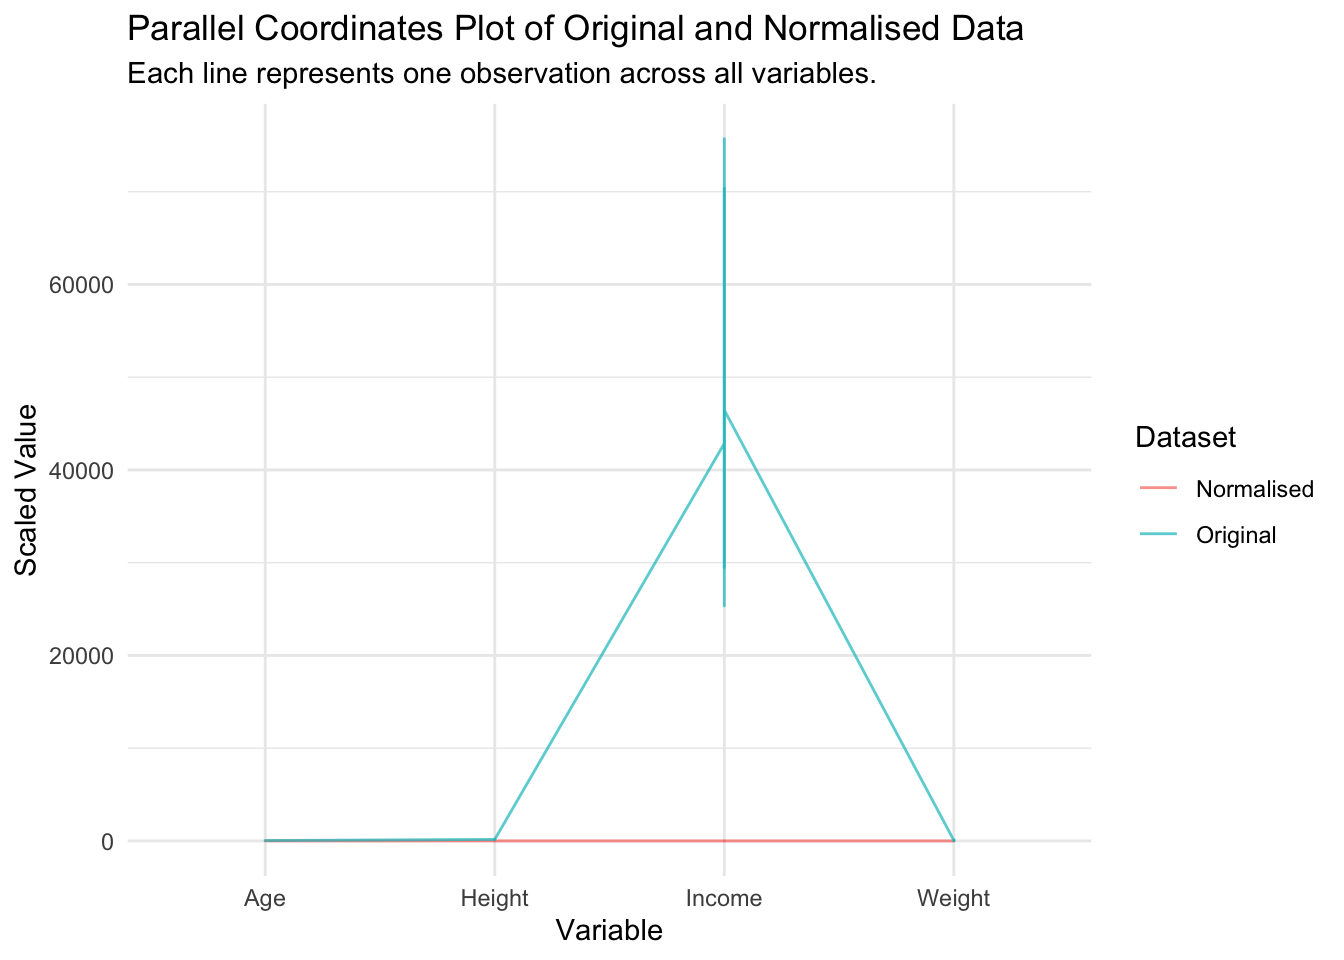
4.4 Normalisation
In this context, normalisation involves adjusting the data in such a way that each data point (or sample) is transformed to have the same scale.
This is done so that no single feature or data point dominates others because of its scale, which is particularly important in various algorithms, especially those used in machine learning and statistics.
4.4.1 Range Normalisation ([0,1])
This is similar to min-max scaling, but specifically refers to scaling individual data points.
4.4.2 Vector Normalisation (Unit Length)
Introduction
Vector normalisation is where we adjust the length of a vector so that it becomes 1 unit long, while retaining its direction.
This is especially useful in algorithms where the scale of the data impacts the outcome (e.g., in clustering or principal component analysis).
The reason for normalising a vector to unit length is to remove the influence of the magnitude of the data, allowing different data points to be compared based solely on their direction. This can help identify patterns where the direction of the data is more informative than its size or length.
Process
Calculate the magnitude (norm) of the vector, which is the square root of the sum of the squared components of the vector. Divide each component of the vector by its magnitude. This scales the length of the vector to 1, known as a unit vector, without altering its direction.
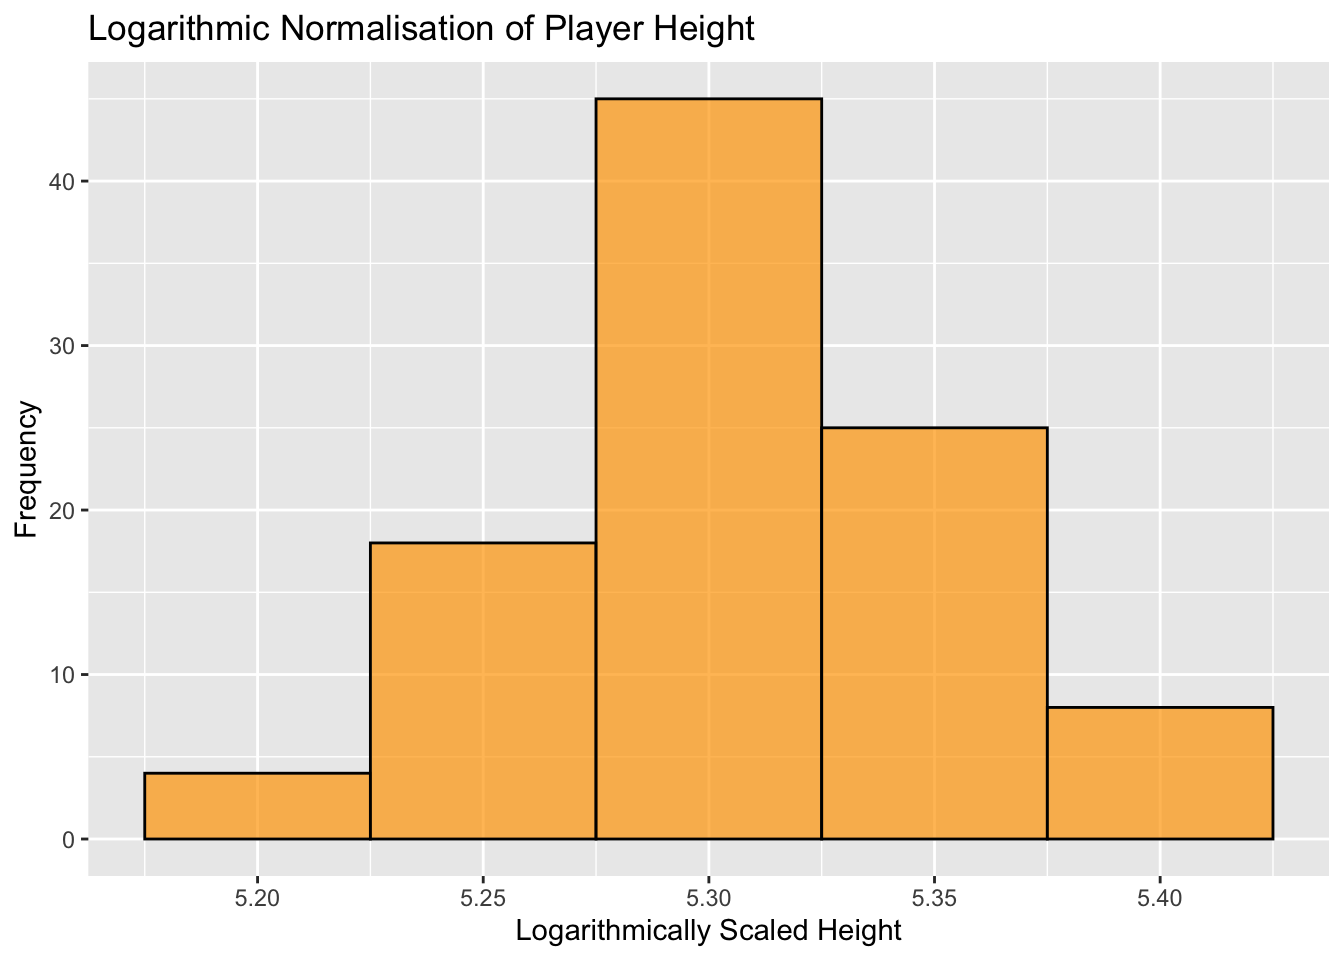
4.4.3 Logarithmic Normalisation
This method can help manage skewed data, transforming it into a more Gaussian-like distribution.
4.5 Summary
In this chapter we’ve covered the main approaches to data transformation. The importance of transforming our data has been highlighted, as failing to do so can have a significant impact on the performance of the statistical models covered later in the module.